Interesting one today:
Earlier this week, while playing one of our cloud database servers, ran into this confusing error.
Error Message:
A connection was successfully established with the server, but then an error occurred during the
login process. (provider: SSL Provider, error: 0 - The certificate chain was issued by an authority
that is not trusted.) (Microsoft SQL Server, Error: -2146893019)

The certificate chain was issued by an authority that is not trusted

Connection Certificate Error
Details:
This is one of those Sql Server errors that are clear and actionable. It clearly indicates that a connection to Sql Server was successfully established, but the encryption certificate (for secure communications) was the problem.
Seems like SSMS received the certificate from the server but it does not seem to be from one of the Trusted Certificate Authorities (CA) — hence the failure in going forward with maintaining the connection.
My guess is that this certificate is used both for identification (authentication) and encryption.
- You are who you say you are (for both parties)
- If I send you something, only you can decrypt it and vice versa
Usually these certificates are issued by CAs, Certificate Authorities, that verify you before giving you a public and private key. But Windows allows us to generate our own certificates for free, but these do not come with seal of approval from CAs.
In our case, its the latter. The certificate sent to SSMS was a generated one and not a CA issues certificate. Hence the error message.
Resolution:
Go to “Connect to Server” pop-up window >> Options >> Check “Trust server certificate“.
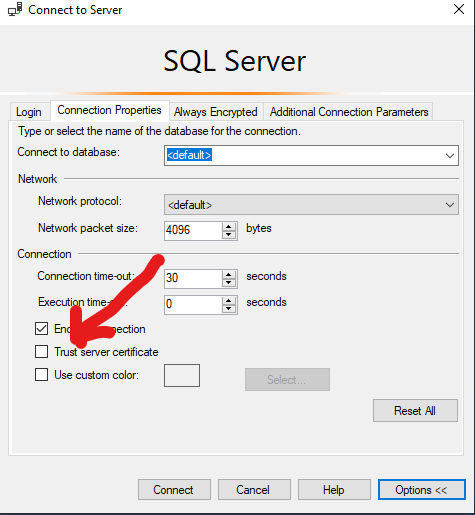
Trust Connection Certificate
Once selected, SSMS will accept the remote certificate and complete connection.