Feeds:
Posts
Comments

Archive for July, 2016

Quick one today:

Once in a while we need a way to quick check how the database files are growing. This below script allows us to query the last few “AutoGrowth” events on database files.

Every time, autogrowth happens, it is logged in the trace file. Since Sql Server has a default trace file running all the time, we query it for autogrowth events.

Note: Data in trace file only stays there for a short period of time (depending on retention), so if this particular event did not occur in the recent past it may not be in the trace file anymore.

According to Event Class  List:

  1. 92 is for Data file auto growth
  2. 93 is for Log file auto growth
--
--	Get the trace file name
--
DECLARE @TraceFile NVARCHAR(1000);

SELECT @TraceFile = path
FROM sys.traces
WHERE is_default = 1;

--
--	Look for 'AutoGrowth' events in TraceFile
--
SELECT    TOP 10
		  DatabaseID				AS [Database_ID]
		, DB_NAME(DatabaseID)		AS [Database_Name]
		, FileName					AS [DatabaseFileName_Logical]
		, (Duration*1.0/1000000)	AS [TimeSpentOn_AutoGrowth]

FROM sys.fn_trace_gettable(@TraceFile, DEFAULT)

WHERE EventClass IN ( 92	--	DataFile Growth
					, 93)	--	LogFile Growth
AND DatabaseID = DB_ID()
GO
Hope this helps,
_Sqltimes

Read Full Post »

Quick one today:

Sometimes when we are setting up replication on our lab machines, we run into this error:

TITLE: Configure Distribution Wizard
------------------------------

An error occurred configuring SQL Server Agent.

------------------------------
ADDITIONAL INFORMATION:

RegCreateKeyEx() returned error 5, 'Access is denied.' (Microsoft SQL Server, 
Error: 22002)

For help, click: http://go.microsoft.com/fwlink?ProdName=Microsoft%20SQL%20Server&ProdVer=12.00.2000&EvtSrc=MSSQLServer&EvtID=22002&LinkId=20476

------------------------------
BUTTONS:

OK
------------------------------


Resolution:

This is easy to fix.

When you are going through the “Configure Distributor” wizard, do not select the option to “Yes, configure Sql Server Agent to start automatically“. Choose “No, I will start the Sql Server Agent manually” and go through the steps.

Once completed, go to Sql Server Configuration Manager and set the agent to start automatically.

The account under which these wizard runs does not have permissions to make registry changes. So just use the easier workaround.
Hope this helps,
_Sqltimes

Read Full Post »

Quick one today:

In a clustered environment, sometimes there is a need to query Cluster Name, Node Name, Instance Name individually; The following script uses SERVERPROPERTY to retrieve that information:

SELECT    SERVERPROPERTY('MachineName')					AS [Cluster_Instance_Name]
		, SERVERPROPERTY('ComputerNamePhysicalNetBIOS') AS [NodeName]
		, SERVERPROPERTY('IsClustered')					AS [Is_Clustered]
		, SERVERPROPERTY('ServerName')					AS [MachineName_InstanceName]
		, CASE
			WHEN ISNULL(SERVERPROPERTY('InstanceName'), 0) = 0
				THEN 'Default Instance'
			ELSE SERVERPROPERTY('InstanceName')			END AS [InstanceName]
GO


Buit-In Function & DMV:

To continue the point further; to retrieve all the nodes in the clustered environment, query the built-in function called  :  fn_virtualservernodes(). Looks like Microsoft recommends using this DMV instead : sys.dm_os_cluster_nodes.


Hope this helps,
_Sqltimes

Read Full Post »

Quick one today:

Surprisingly, we’ve been doing a lot of Sql Server Cluster installations in the last few weeks/months. This is a handy chart, helpful to showcase the steps at a VERY high level.

Each step has several sub-steps, which we’ll go into detail in other future posts, but here we just document the high level steps as a guidance or memory bookmark for quick reference.

High Level Steps:

  1. Install Failover Cluster Software through ‘Features’ addition
  2. Include Automation tools within FailOver Clustering
  3. Configure Cluster at OS level on nodes
    1. Validate cluster
  4. Configure MS DTC, if needed: Configure network configuration for MSDTC (Inbound/Outbound):
    1. Component Services >> Computers >> My Computer >> Distributed Transaction Coordinator >> ClusteredDTCs >>DC1REPLS02DTC >> properties >> Security (tab) >> Check Inbound & Outbound
  5. On first node, install Sql Server as Cluster Option
  6. On other nodes, install Sql as “add node”
  7. MS DTC resource mapping for Sql Resource Group
    1. Component Services >> Computers >> My Computer >> Properties >> MSDTC (tab) >> Assign MSDTC for Sql Resource Group from the drop down.

Post Installation Steps:

  1. Add disk dependency
  2. Test Failover with different variables

We’ll go into reasons why we do these steps in future posts.

Hope this helps,
_Sqltimes

Read Full Post »

Important concept today:

Sometimes when we run a query with MAXDOP setting (query hint) as 1, we see that multiple threads are used to execute the query. Why is it?

Short Answer:

MAXDOP query hint does not indicate the number of threads (or parallelism) for the entire query; It only indicates the number of threads for each operator in the query execution plan. So if there are multiple operators, then each operator could potentially get a dedicated thread, resulting in more threads (parallelism) running the query.

Details:

This is a popular misconception. Though Microsoft has documented the underlying behavior, this myth seems to persist.

Sql Server optimizer is very good at coming up with most optimal plan for executing any given query. The better artifacts it has about the data (stats, etc), the more efficient the execution plan. It makes several calculations, about the best way to perform the execution plan. Where needed, it uses parallelism to carry out larger workloads more efficiently.

We have options to specify some query hits to suggest our execution preferences to the Optimizer. While it honors our suggestions, the final say would be based on its own internal calculations.

MAXDOP is one such query hint.

The general understanding is that when we specify MAXDOP to a higher number, Sql Server uses that many worker threads to complete the workload. On the surface it seems correct, but there are some nuances.

Question: If we specify MAXDOP = 1, does Sql Server run the query with just one thread?

Answer: It depends.

For some queries with larger workloads, if the query execution plan has multiple operators (clustered-index-scan, index-seek, nested-loops, etc), then each Operator will get its own thread, even though MAXDOP = 1. Resulting in total, more threads than 1 for query execution.

If MAXDOP=2, then each Operator could get up to 2 threads. Resulting in total, more threads than 2, for query execution.

Conclusion:

MAXDOP setting is used to limit the number of threads per Operator in a query execution plan. It does not indicate the total number of threads used for the entire query.

Suggestions:

To prevent such events, see if MAXDOP setting could be reduced or add any helpful indexes to minimize the time/effort needed to process the query data.


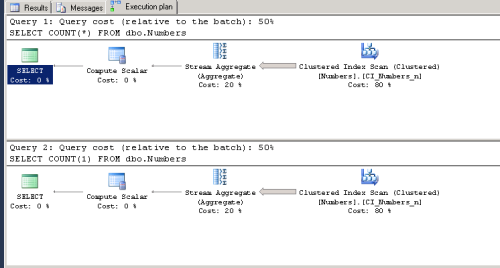
Note: To illustrate this scenario, the sample table code in this post will help quickly create a large table with many records.


Important Note 1:

Please note that the above comments are an explanation to the scenario when Sql Server seems to utilize more threads than MAXDOP setting. This does not mean, it will happen every single time.

It all depends on Optimizer & Execution plan. If Sql Server decides that it is more efficient to carry out the workload with a single thread, then that’s what we’ll see in the sys.processes.


Hope this helps,
_Sqltimes

Read Full Post »

Quick one today:

Microsoft has released a new free ebook along with the release of new version of Sql Server 2016. This is an exciting time !!

Sql Server 2016

Sql Server 2016

Hope you enjoy reading and learning more !! You can download it from here.

Hope this helps,
_Sqltimes

Read Full Post »

Quick one today:

Earlier today, we needed to add a new drive to existing Sql Server cluster. New LUN was created and added to the cluster, but when we tried to add a new data file, this error occured:

Msg 5184, Level 16, State 2, Line 1
Cannot use file 'I:\MSSQL\Data\SsampleDB2.ndf' for clustered server. 
Only formatted files on which the cluster resource of the server has a dependency can be used. 
Either the disk resource containing the file is not present in the cluster group or the 
cluster resource of the Sql Server does not have a dependency on it.

Msg 5009, Level 16, State 8, Line 1
One or more files listed in the statement could not be found or could not be initialized.

The error message is verbose and helpful. It points to the exact things we could check to resolve it.

  1. Either the disk resource containing the file is not present in the cluster group OR
  2. Cluster resource of the Sql Server does not have a dependency on it

The first one did not apply here as the drive was already added to the Cluster through Failover Cluster Manager. So, lets look at the second step.

Dependency chain is an important aspect of Sql Server Clustering. It tells Sql Server what to do in case of failure. A resource group has several resources in it. All the resources in a single resource group act as a single group. They failover as a one unit; Thus providing high availability on the available nodes.

Keep these questions in mind, when you think about different resources in a cluster.

  • What resources belong to a Resource Group?
  • What to do when each of them fail?
    • Do we try to re-start the resource (or NOT)?
    • How many attempts to bring the resource back online?
    • Do we wait a few minutes and then attempt restarting?
    • Does failure of one resource trigger failover of the entire Resource Group?
    • Do we just failover that single resource?  (for this to happen, that resource needs to be in its own Resource Group

All these points are answered during the configuration of resources to a cluster.

For this situation, we need to add this new drive to the dependency chain for Sql Server Resource Group.

Resolution Steps:

Step 1:

First, go to Failover Cluster Manager. Under the relevant cluster name, go to Roles; On the right-hand window, highlight the Resource Group that has Sql Server resources. In our situation, it is called: Sql Server (MSSQLSERVER). See below:

Step 1: Sql Cluster Add NewDrive

Step 1: Sql Cluster Add NewDrive

Step 2:

When Sql Server Resource Group is highlighted, go to the bottom window, where details are displayed. It has two tabs.

  1. Summary
  2. Resources

Go to Resources tab; Here you might see a few sections.

  1. Storage:  All the drives added to this cluster Resource Group are listed here. Make sure the new drive can be seen in the list.
  2. Server Name : These are the logical Cluster Name and IP addresses
  3. Other Resources : Depending on the resources added, we see Sql Server, Sql Server Agent, MSDTC, etc

Right click on Sql Server, and go to properties.

Step 2: Sql Cluster Add NewDrive

Step 2: Sql Cluster Add NewDrive

Step 3:

In Properties window, go to Dependencies tab. Here we configure the Dependency Chain for Sql Server Resource in the Resource Group called Sql Server(MSSQLSERVER). Each and every data drive is critical for Sql Server to function properly. So, we use AND condition to specify that each and every drive is needed.

Click on Insert button, add condition as AND & pick the new Cluster Disk in the drop down under the Resource side.

Sql Cluster Add NewDrive 3

Sql Cluster Add NewDrive 3

Click ok and Voila !! The new drive is added to the “Dependency Chain”. For more information about the Cluster response to failure, review the options under the Policies tab in the same Properties window.

Now we could add a new NDF file to the new drive location.

Hope this helps,
_Sqltimes

Read Full Post »

Quick one today:

Very often, this comes up in regular conversations. What is the difference between COUNT(*) & COUNT(1)?

Short Answer

No difference; They perform the same and give the same result. Internally they work almost the same way too.

Details

Lets look at some artifacts:

--
-- Capture execution plans between both the styles
--
SET STATISTICS IO ON
SET STATISTICS TIME ON

SELECT COUNT(*) FROM dbo.Numbers
GO
SELECT COUNT(1) FROM dbo.Numbers
GO

SET STATISTICS IO OFF
SET STATISTICS TIME ON
GO

Execution Plans:

The plans look exactly the same, including the details of each step a.k.a. Operator Cost, Physical Operation, Subtree Cost, etc.

Difference_between_two_execution_plans..PNG

I/O Metrics

As you can see, the logical & physical I/O on both the queries is exactly the same.

-- COUNT(*)
Table 'Numbers'.
    Scan count 1,
    logical reads 1703,
    physical reads 0,
    read-ahead reads 0,
    lob logical reads 0,
    lob physical reads 0,
    lob read-ahead reads 0.

-- for COUNT(1)
Table 'Numbers'.
    Scan count 1,
    logical reads 1703,
    physical reads 0,
    read-ahead reads 0,
    lob logical reads 0,
    lob physical reads 0,
    lob read-ahead reads 0.


CPU Artifacts

CPU consumption has a slight variation. COUNT(*) uses a few more CPU cycles than COUNT(1). Is this significant? Not really.

--For COUNT(*)
SQL Server Execution Times:
   CPU time = 187 ms,  elapsed time = 197 ms.
SQL Server parse and compile time:
   CPU time = 0 ms, elapsed time = 0 ms.

-- For COUNT(1)
SQL Server Execution Times:
   CPU time = 171 ms,  elapsed time = 176 ms.
SQL Server parse and compile time:
   CPU time = 0 ms, elapsed time = 0 ms.


Important point to note here is the order in which you run them. Which ever is run first, that performs physical I/O, that the subsequent COUNT query does not need to do. Other than that, they seem very similar in performance.


Important Point: Even when I ran these queries on a very large table, they performed exactly with the same performance metrics. The CPU difference was negligible (only 4 milliseconds).

Note: If you are running counts on larger tables, use COUNT_BIG(*).


Hope this helps,
_Sqltimes

Read Full Post »